Here are the main things to remember about using TradingView for trading CFDs in Australia.
Key Takeaways
- TradingView is a popular online tool for looking at financial markets and charts.
- It has lots of features like drawing tools, indicators, and screeners to help you analyse trades.
- You can connect your Australian broker to TradingView to trade directly from the charts.
- Always be aware of the risks involved with CFD trading and use tools like stop-loss orders.
- TradingView offers both free and paid versions, so you can pick what suits your budget and needs.
Understanding TradingView For Australian Traders
Right then, let’s talk about TradingView. If you’re trading Contracts for Difference (CFDs) here in Australia, you’ve probably heard the name, and for good reason. It’s basically a super popular online charting and analysis tool that a whole heap of traders use. Think of it as your digital workbench for looking at markets. It’s not just for stocks either; you can use it for forex, crypto, commodities – pretty much anything that moves price-wise. TradingView gives you the tools to see what’s happening in the market in real-time.
What is TradingView?
At its core, TradingView is a platform where you can look at charts, analyse price movements, and even share ideas with other traders. It pulls in live data from various exchanges and brokers, so you’re always looking at what’s happening right now. It’s a bit like having a super-powered magnifying glass for financial markets. You can use it to get a good handle on how CFDs work and see how their prices are behaving.
Key Features of the TradingView Platform
So, what makes it so popular? Well, it’s packed with features. You get:
- Advanced Charting: This is the main event. You can change chart types, timeframes, and add all sorts of visual aids.
- Technical Indicators: Stuff like Moving Averages, RSI, MACD – all built-in to help you spot trends or potential turning points.
- Drawing Tools: Lines, shapes, text – handy for marking up your charts and keeping track of your analysis.
- Community Ideas: Other traders share their charts and thoughts, which can be interesting, though always do your own homework.
- Screeners: Tools to help you find specific assets based on certain criteria.
Accessing TradingView: Web and Mobile
One of the best things is how easy it is to get to. You can use it straight from your web browser – no downloads needed, just head to the TradingView website. This is great for quick checks or if you’re on a computer that isn’t yours. But they also have mobile apps for both iOS and Android. This means you can keep an eye on your trades or do some analysis while you’re out and about, maybe even while you’re waiting for your coffee. It’s pretty handy for staying connected to the markets.
You don’t need to be a whiz with computers to get started. The platform is designed to be pretty straightforward, even if you’re new to charting software. There are plenty of resources available to help you get the hang of it, including a big community of users who often share tips and tricks.
Getting Started With TradingView CFD Australia
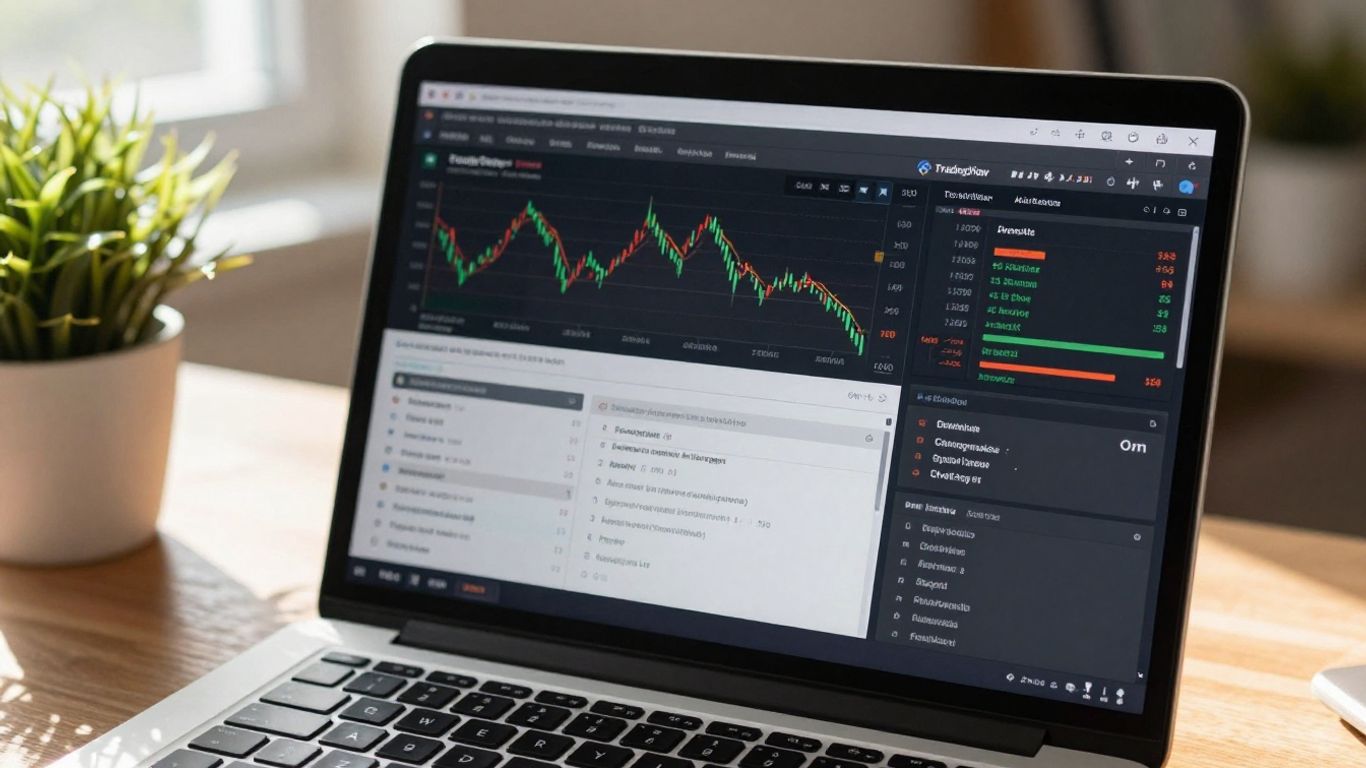
So, you’re keen to start trading Contracts for Difference (CFDs) here in Australia and want to know how to get your head around TradingView? It’s a pretty popular platform, and for good reason. Let’s break down how to get yourself set up.
Signing Up for a TradingView Account
First things first, you’ll need an account. Head over to the TradingView website. You’ll see a "Sign up" button, usually in the top right corner. Clicking that will give you a few options for creating your account. You can use your email address, or link up with your Google, Facebook, or LinkedIn accounts. Choose the method that feels easiest for you. Once you’ve filled in the details, you’re in!
Navigating the TradingView Interface
Once you’re logged in, you’ll land on the main page. It might look a bit busy at first, but it’s organised pretty logically. You’ve got a few main sections:
- Products: This is where you’ll find the charts, heat maps, screeners, and the economic calendar.
- Community: A place to see what other traders are sharing – ideas, strategies, and custom indicators.
- Markets: Here you can search for and analyse different financial instruments like stocks, forex pairs, and cryptocurrencies.
- News: Real-time news feeds relevant to the markets.
- Brokers: A list of brokers that can connect with TradingView. It’s worth checking this out if you’re looking for a broker that integrates well.
When you select "Products" and then "Supercharts," you’ll get to the main charting area. This is where the magic happens. You’ll see toolbars on the left and top for drawing and adding indicators, a watchlist on the right, and the main chart in the centre. It’s all about getting familiar with where everything is.
Customising Your TradingView Workspace
TradingView lets you tweak things to suit how you like to trade. You can add or remove panels, change the layout, and save your preferences. For instance, you can add a new chart by clicking the "Add Symbol" icon in the top right toolbar. To find a specific asset, use the "Symbol Search" icon on the top left toolbar. Just type in the name or ticker symbol, and click on it when it appears. You can then change the chart type (like candlestick or bar charts) and timeframes using the options at the top of the chart. It’s all about making the platform work for your CFD trading strategy.
The interface is designed to be flexible. Don’t be afraid to click around and see what different buttons do. You can always reset things if you mess them up. Getting comfortable with the layout is half the battle when you’re starting out.
Leveraging TradingView’s Charting Tools
Alright, let’s get into the nitty-gritty of TradingView’s charting capabilities. This is where the real analysis happens, and honestly, it’s pretty impressive what you can do right from your browser.
Understanding Chart Types and Timeframes
First off, you’ve got different ways to look at price action. The most common is the candlestick chart, which gives you a lot of info at a glance – the open, high, low, and close for a specific period. But TradingView offers others too, like bar charts, line charts, and even Heikin Ashi, which can smooth out price movements. Choosing the right chart type really depends on what you’re trying to see. The timeframe you select is just as important; it dictates the period each candle or bar represents. Are you looking at the big picture with daily or weekly charts, or are you trying to catch quick moves on a 5-minute or 1-minute chart? You can easily switch between these using the timeframe selector, usually found near the top of the chart. Learning how these charts and timeframes work is key to optimising your trading strategies.
Here’s a quick rundown of some common chart types:
- Candlestick: Shows open, high, low, and close. Great for visualising price swings.
- Bar Chart: Similar to candlesticks but uses lines to show open, high, low, and close.
- Line Chart: Connects closing prices, good for spotting overall trends.
- Heikin Ashi: A modified candlestick that helps filter out market noise.
Utilising Drawing Tools for Analysis
Beyond just looking at the price bars, TradingView gives you a whole toolbox for drawing on your charts. This is super handy for marking up support and resistance levels, identifying trendlines, or spotting chart patterns. You’ll find tools for drawing simple trendlines, horizontal lines, vertical lines, parallel channels, and even Fibonacci retracements. Don’t be afraid to experiment with these. Drawing a trendline is pretty straightforward: just click the tool, pick your start point, and click your end point. You can then tweak the colour, thickness, and style of the line to make it stand out. It helps to use the grid on the chart to keep things aligned.
Marking up your charts with trendlines and support/resistance levels can really help you visualise potential entry and exit points. It’s a visual way to apply your trading ideas.
Adding Technical Indicators to Your Charts
This is where things get really interesting. TradingView has a massive library of built-in technical indicators. Think moving averages, RSI, MACD, Bollinger Bands – you name it, they probably have it. To add an indicator, you just click the ‘Indicators’ button, search for what you want, and click to add it to your chart. You can usually add multiple indicators and even compare them. Each indicator has its own settings that you can adjust to suit your trading style. For example, you might want to change the period of a moving average or the overbought/oversold levels on an RSI. It’s all about finding what works for you and your chosen assets. You can find a free app for tracking all markets that includes these advanced charting features.
Advanced TradingView Features for CFDs
Right, so you’ve got the basics down pat with TradingView’s charting and indicators. Now, let’s look at some of the more powerful stuff that can really help you out when you’re trading Contracts for Difference (CFDs) here in Australia. These features can give you an edge, helping you spot opportunities and manage your trades better.
Exploring the Stock and Forex Screeners
Think of screeners as your personal market detectives. Instead of manually sifting through hundreds of potential trades, screeners do the heavy lifting for you. You set the criteria – like a stock’s market cap, a currency pair’s volatility, or a specific technical pattern – and the screener spits out a list of instruments that match. It’s a massive time-saver, especially if you trade a lot of different markets. You can find these screeners under the ‘Products’ tab on TradingView. They’re pretty customisable, so you can really dial in what you’re looking for. For example, you might want to find Australian stocks that have recently broken above their 200-day moving average, or forex pairs showing strong upward momentum.
Backtesting Strategies with Pine Script
This is where things get really interesting. TradingView has its own scripting language called Pine Script. It lets you create your own custom indicators or, more importantly for this section, backtest trading strategies. Basically, you can code up a strategy – say, buy when the RSI crosses above 30 and sell when it crosses below 70 – and then run it on historical data. This shows you how that strategy would have performed in the past. It’s a fantastic way to test your ideas without risking real money. You can find the Pine Editor at the bottom of the TradingView platform. It takes a bit of learning, but there are heaps of resources and examples online to get you started. It’s a bit like learning a new language, but the payoff can be huge in understanding what works and what doesn’t.
Setting Up Custom Alerts for Market Movements
Markets don’t just move during business hours, and you can’t stare at charts all day. That’s where alerts come in. TradingView lets you set up alerts for all sorts of conditions. You can get an alert when a price hits a certain level, when an indicator crosses a threshold, or even when a specific pattern forms on your chart. These alerts can be sent to your phone, email, or pop up on your TradingView screen. This means you won’t miss out on a trading opportunity just because you weren’t watching. For instance, you could set an alert for a breakout on a particular currency pair or when a specific Australian company releases its quarterly earnings. It’s a smart way to stay connected to the markets, even when you’re away from your desk. You can connect your broker to TradingView to act on these opportunities quickly if they support it.
Using these advanced features requires a bit of effort to learn, but they can significantly improve your trading process. Think of them as tools to help you make more informed decisions, rather than magic bullets. The more you practice with them, the more comfortable you’ll become in using them to your advantage in the Australian CFD market.
Connecting Your Broker to TradingView
So, you’ve got your TradingView charts looking sharp and you’re ready to actually trade those CFDs. That’s where connecting your brokerage account comes in. It means you can ditch switching between windows and place trades right from your TradingView setup. Pretty handy, right?
Supported Brokers for TradingView Integration
TradingView plays nice with a bunch of brokers, which is great news for us Aussies. You’re not limited to just one or two options. Some brokers are more popular than others, often because they offer competitive fees or a wider range of tradable instruments. For instance, Interactive Brokers is often mentioned as a top pick for Australian traders using TradingView, known for its low costs and good research tools. Capital.com is another one that pops up, especially if you’re focused on low CFD fees. It’s always a good idea to check the TradingView brokers page to see who’s currently listed and what they offer.
Linking Your Brokerage Account Seamlessly
Connecting your account is usually pretty straightforward. Most brokers have a dedicated section within TradingView, often found in the trading panel or a specific ‘Broker Connections’ area. You’ll typically need to log in to your brokerage account through a pop-up window that TradingView provides. It’s like giving TradingView permission to talk to your broker. Make sure you have your login details handy. Some brokers, like Opofinance, have made it really easy to get connected directly from your charting interface.
Placing Trades Directly from TradingView
Once your broker is linked, you’ll see options to place buy or sell orders directly on the chart or within the trading panel. You can usually set your order type (market, limit, stop), specify the quantity, and importantly, set your take-profit and stop-loss levels right there. This integration is what really streamlines your trading workflow. Instead of just analysing, you’re actively managing your positions without leaving the platform. It’s a big step up from just watching the charts.
The ability to trade directly from TradingView saves a heap of time and reduces the chance of errors when you’re trying to get into or out of a trade quickly. It keeps your focus on the market action rather than fumbling with different platforms.
Trading CFDs Effectively with TradingView
So, you’ve got your TradingView charts all set up, and you’re ready to start trading Contracts for Difference (CFDs) in Australia. That’s great! But before you jump in headfirst, let’s talk about how to do it smartly. Trading CFDs can be a bit tricky, and using TradingView effectively means understanding the risks and having a solid plan.
Understanding CFD Trading Risks
First things first, CFDs are complex products. They come with a high risk of losing money quickly because of the leverage involved. It’s not like buying shares directly; you’re essentially betting on the price movement of an underlying asset. This means you can make money fast, but you can also lose it just as quickly. It’s super important to only trade with money you can afford to lose.
Here are some key risks to keep in mind:
- Leverage: While leverage can amplify your profits, it also amplifies your losses. A small price move against you can wipe out your entire investment.
- Market Volatility: Prices can swing wildly, especially with certain assets like cryptocurrencies or volatile stocks. This unpredictability adds another layer of risk.
- Counterparty Risk: Although less common with reputable brokers, there’s always a small risk associated with the broker itself.
- Overnight Fees (Swaps): If you hold a CFD position overnight, you’ll usually pay a fee, which can add up over time.
Remember, CFDs aren’t suitable for everyone. Make sure you fully grasp the risks before you start trading. TradingView can help you analyse the markets, but it can’t eliminate the inherent risks of CFD trading.
Managing Trades with Take-Profit and Stop-Loss
This is where TradingView really shines for CFD traders. You can set up your trades with built-in risk management tools. Take-profit and stop-loss orders are your best mates here. A stop-loss order automatically closes your trade if the price moves against you to a certain level, limiting your potential losses. A take-profit order does the opposite – it closes your trade when it reaches a profit target you’ve set. You can often set these directly on the chart when you place a trade, or adjust them later by dragging the lines. This helps you stick to your trading plan and avoid emotional decisions. You can explore trading ideas and strategies to help you decide where to set these levels.
Analysing Market News and Economic Events
While TradingView is fantastic for technical analysis, you can’t ignore the news. Economic events, company announcements, and global news can cause significant price movements in CFDs. TradingView has a news feed and a calendar that can help you stay informed. For example, if you’re trading an Australian index CFD, you’ll want to keep an eye on RBA announcements or major economic data releases. Understanding how these events might impact the market you’re trading is just as important as reading the charts. You can even find specific analysis for instruments like the VANTAGE-SPI200, which can be quite useful for Australian traders. Compare different strategies and see how news might affect them.
TradingView Pricing and Account Options
So, you’re keen to get stuck into TradingView for your CFD trading here in Australia. That’s a smart move. But before you jump in, it’s worth knowing what it’s going to cost you. TradingView actually offers a pretty decent free account, which is a great way to start and see if it’s your cup of tea. You get access to a lot of the core features, which is fantastic for getting your bearings.
Exploring Free vs. Paid TradingView Plans
The free plan is a good starting point, no doubt about it. You can check out charts, use some basic drawing tools, and even add a few indicators. It’s perfect for beginners or those who don’t need all the bells and whistles. However, there are some limitations. For instance, you can only have one chart per tab and a limited number of indicators on each chart. If you plan on doing more in-depth analysis or want to keep multiple market views open at once, you might find yourself hitting a wall pretty quickly.
Here’s a quick look at what you generally get:
- Free Plan: Access to basic charting, limited indicators, one chart per tab.
- Paid Plans (Essential, Plus, Premium): More indicators per chart, multiple charts per tab, ad-free experience, priority support, and other advanced features.
Choosing the Right Subscription for Your Needs
When you’re ready to upgrade, TradingView has a few paid tiers: Essential, Plus, and Premium. These plans are usually available on a monthly or annual basis, with the annual option typically offering a bit of a discount. The Essential plan is a step up from free, offering more indicators and charts. The Plus plan gives you even more, and the Premium plan is for the serious traders who want everything TradingView has to offer, like more alerts and faster data. The best plan for you really depends on how much you plan to use the platform and what specific features you need for your trading style. For example, if you’re constantly switching between different markets or need to overlay several indicators to spot patterns, a paid plan is almost a must. You can always start with a lower tier and upgrade later if you find you need more. It’s also worth noting that some brokers, like Trade Nation, integrate directly with TradingView, which can sometimes come with specific benefits or pricing structures for their clients, so it’s worth checking that out too.
Deciding on a subscription can feel a bit overwhelming at first. Think about your current trading habits and what you anticipate needing as you get more comfortable. Don’t feel pressured to go for the top-tier plan straight away; you can always adjust as your needs evolve. Many traders find that starting with a mid-tier plan hits a sweet spot between cost and functionality.
Conclusion
So, that’s a wrap on using TradingView for CFD trading in Australia. It’s a pretty powerful platform, and once you get the hang of it, it can really help you make better trading decisions. Remember to practice, understand the risks, and keep learning. Happy trading!
Frequently Asked Questions
What exactly is TradingView?
Think of TradingView as a super-advanced online charting service. It lets you see how prices of things like stocks and forex move over time. Lots of traders use it to study the markets before they decide to buy or sell.
Is TradingView free to use?
You can definitely use TradingView for free, which is great for starting out. It gives you access to most of the main features. If you want more advanced options, like using more charts at once or adding lots of indicators, they have paid plans too.
Can I trade CFDs directly on TradingView in Australia?
Yes, you can! TradingView works with many brokers, including some popular ones in Australia. This means you can link your trading account and place buy or sell orders right from the TradingView charts, which is super convenient.
Is TradingView good for beginners?
Absolutely. TradingView has a simple layout and lots of helpful tools that even new traders can understand. They also have a ‘paper trading’ feature where you can practice with fake money, so you can learn without risking your own cash.
What are CFDs and are they risky?
CFDs, or Contracts for Difference, are agreements to exchange the difference in price of an asset. They can be risky because you can use borrowed money (leverage) to trade, which can make your profits bigger, but also your losses. It’s really important to understand this risk before you trade.
How do I set up alerts on TradingView?
Setting up alerts is easy. Once you have a chart open, look for the alert icon, usually near the top. You can then choose the price level or condition you want to be notified about, and TradingView will let you know when it happens.