Key Takeaways
The S&P 500 and ASX 200 both provide broad index exposure through CFDs, but they behave differently because their markets, sectors and trading sessions are not the same.
- The S&P 500 covers 500 large US companies, while the ASX 200 tracks 200 major Australian shares.
- Australian traders may find the ASX 200 easier to follow during local market hours.
- The S&P 500 generally offers deeper global participation and strong liquidity around the US session.
- Spreads, funding, contract size, currency conversion and dividend adjustments all affect trading costs.
- Leverage makes disciplined position sizing and clearly defined risk essential for either index.
How the S&P 500 and ASX 200 compare
Trading the S&P 500 CFD vs ASX 200 CFD starts with understanding what sits beneath each price. Neither CFD gives ownership of the underlying shares; instead, it provides exposure to changes in an index quotation. The useful comparison is therefore not simply which index is “better”, but which market fits the trader’s timing, risk tolerance and economic view.
What each index represents
The S&P 500 is a benchmark made up of 500 large companies listed in the United States. The ASX 200 measures the performance of 200 major companies listed on the Australian Securities Exchange. Both turn a group of share prices into one market reference, although their constituents and weightings mean that the indices can respond to very different news.
A CFD lets a trader take a long or short position on that movement without buying every company in the basket. A broader explanation of stock index trading can help clarify how indices are calculated, weighted and used for macro views.
Sector exposure and market composition
The S&P 500 has substantial exposure to large technology, communications, healthcare, financial and consumer businesses. The ASX 200 has a stronger presence from financial companies and resources businesses, with mining and commodity-linked shares playing a prominent role. This does not make either index a pure sector trade, but it does shape the type of news likely to move it.
For example, a change in expectations for technology earnings may be especially influential in the S&P 500. A shift in iron ore prices, bank conditions or Chinese demand may matter more immediately for the ASX 200.
US market size versus Australian concentration
The US equity market is much larger and attracts participation from investors around the world. That scale can create a deep, continuously watched market, particularly during the US session. Australia’s market is smaller and more concentrated, so a relatively limited group of large companies can have a noticeable effect on the headline index.
This concentration can be useful when a trader has a clear view on Australian banks, miners or the local economy. It can also mean that the ASX 200 does not always behave like a straightforward version of the broader global share market.
Why index composition affects CFD trading decisions
Index composition affects both analysis and risk. A trader who treats the two markets as interchangeable may miss the way sector weightings, local data and currency movements alter the response to the same global event. Know what drives the basket before deciding that a chart pattern has the same meaning on both indices.
The choice of index can also influence a hedging decision, the time of day selected for entry and the size of a position. Broad exposure is still exposure to a particular mix of companies, not to an abstract market average.
Trading hours and market access
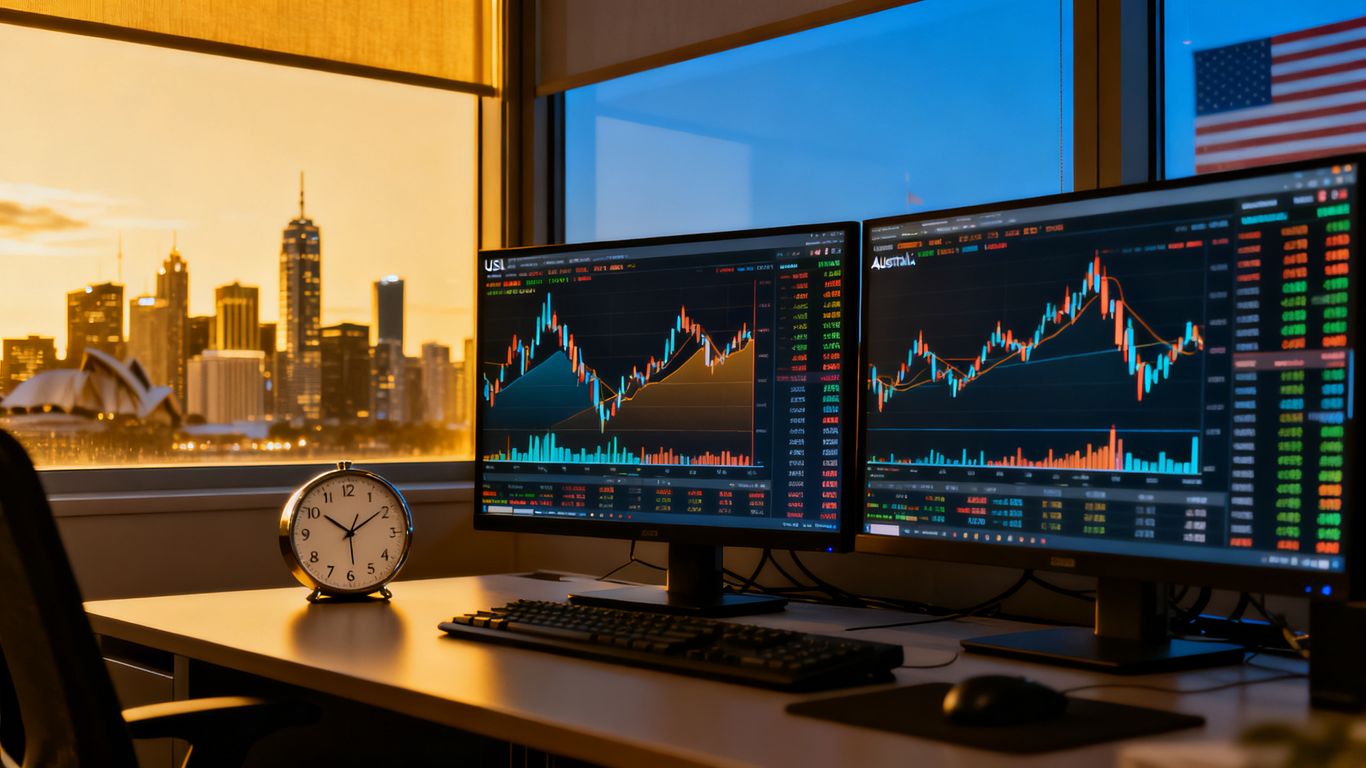
Trading hours are one of the clearest practical differences between the two CFDs. The ASX 200 follows the rhythm of the Australian cash market, while the S&P 500 is most active when the US market is open. Brokers may also quote index CFDs outside the main cash session, but those prices can behave differently from prices during peak activity.
ASX 200 trading hours in Australian time
The ASX cash market operates during Australian business hours, with an opening auction followed by the regular session and a closing process. Exact times can vary with daylight saving arrangements and the broker’s product specification, so traders should check the current schedule rather than rely on a fixed conversion.
For an Australian-based trader, the local session is usually easier to monitor without staying awake late at night. The trade-off is that some international developments are reflected through opening gaps or early-session volatility rather than continuous local trading.
S&P 500 trading hours and the US session
The S&P 500 is most active during the US trading session, which falls in the evening or overnight for much of Australia. US daylight saving changes can shift the local opening time by an hour. The cash-market open is often a particularly watched moment because it brings a large flow of orders and fresh information into the market.
Some CFD providers also make related index prices available beyond the cash session. Index CFD markets can therefore offer access to major global benchmarks, but the exact quoted hours and conditions remain product-specific.
Overnight trading and out-of-hours pricing
Out-of-hours pricing can be useful for reacting to a major announcement, but it should not automatically be treated as equivalent to regular-session trading. Fewer participants, wider spreads or a greater sensitivity to futures and news can change how an order is filled.
A trader holding an S&P 500 position through the Australian night should be especially conscious of scheduled US releases and the possibility of rapid movement. The same principle applies to an ASX 200 position held beyond the local close while overseas markets continue to move.
How market overlap affects liquidity and execution
Liquidity often improves when the relevant cash market is open and participation is highest. The most attractive execution window is not necessarily the same for every strategy: a short-term trader may prefer active periods, while a swing trader may accept less immediate liquidity in exchange for holding a broader view.
Focus Markets lists index CFDs among its available markets and provides access through MT5, according to its index CFD information. That does not remove the need to check contract hours, spreads and order rules before trading.
Volatility, liquidity and price behaviour
Volatility is not a permanent ranking between the S&P 500 and ASX 200. It changes with earnings, central-bank expectations, commodity prices, geopolitical events and the point in each market’s trading cycle. The more useful question is when movement is likely to accelerate and whether the quoted market can absorb orders efficiently.
Typical volatility differences between the indices
The S&P 500 may experience strong moves when US technology shares, interest-rate expectations or major corporate earnings change. The ASX 200 can react sharply to resources, banks and global risk sentiment, particularly when commodity prices or China-related expectations shift.
Neither index should be assumed to be consistently calmer. A quiet-looking session can turn quickly after a surprise release, and a familiar average daily range does not protect a highly leveraged position from an exceptional move.
The impact of US and Australian economic data
Australian employment, inflation, retail sales and Reserve Bank decisions can influence the ASX 200 through interest rates and the domestic growth outlook. US inflation, payrolls, Federal Reserve decisions and company earnings are central drivers for the S&P 500.
The data also travels across borders. A major US rate repricing can affect Australian shares, while a sharp move in commodities or the Australian dollar can alter sentiment towards Australian companies.
Opening gaps and international market movements
Because the local cash sessions do not overlap perfectly, each index can open with information accumulated while its underlying market was closed. Futures, currencies and overseas share prices may all contribute to the opening level. A gap can continue, retrace or remain unresolved; it is not a signal with a guaranteed outcome.
This is one reason overnight risk matters for swing trades. A stop order may help define an intended exit, but execution can still be affected by a gap between quoted prices.
Liquidity, spreads and slippage during major events
Spreads and slippage can change around economic releases, market opens and sudden news. A tight spread in a calm session does not guarantee the same cost during a volatile announcement. Traders should review the broker’s execution policy and avoid assuming that a displayed price will remain available.
A practical review before an event includes:
- checking the scheduled release and the likely active session;
- confirming the stop distance and maximum acceptable loss;
- reducing exposure if the position is too large for the expected movement;
- checking whether the CFD can be traded during the relevant out-of-hours period.
These steps are simple, but they turn a general warning about volatility into an actual trading routine.
Costs of trading the S&P 500 CFD vs ASX 200 CFD
The headline spread is only one part of the cost of an index CFD. The full calculation can include commissions, overnight funding, currency conversion, dividend adjustments and the effect of contract size. Costs also depend on whether the trade is opened and closed quickly or held through several market sessions.

Spreads, commissions and broker charges
A spread is the difference between the buy and sell quotation. Some accounts may use spread-only pricing, while others may combine tighter spreads with a commission. The relevant comparison is the total expected cost for the trade, not the smallest advertised number in isolation.
Focus Markets describes Standard and Raw accounts for its index CFD offering, with different spread and commission structures. Traders should read the current product schedule and calculate the cost for their intended size and holding period.
Overnight funding and holding positions
Holding a CFD beyond the broker’s daily funding time can create an overnight adjustment. The amount depends on the provider, instrument, direction and applicable rate. A position that appears inexpensive for an intraday trade may become materially more expensive if held for weeks.
Before entering a longer trade, estimate the likely number of funding charges and compare that amount with the planned risk and potential return. Funding is a carrying cost, not a substitute for a view on the index.
Dividends and index adjustment payments
Index constituents may pay dividends, and the index level can reflect those distributions. A CFD provider may apply a cash adjustment to long or short positions according to its contract terms and the relevant ex-dividend dates. The treatment is not identical to owning the shares directly.
These adjustments can be particularly relevant for a position held across several constituent ex-dividend dates. The broker’s instrument specification should explain whether and when an adjustment is made.
How contract specifications affect total costs
Contract specifications determine the value of each index point, minimum trade size, margin requirement, trading hours and funding rules. Those details can make two apparently similar CFDs quite different in practice. A trader should compare them before looking only at recent price performance.
| Cost or specification | Why it matters | What to check |
|---|---|---|
| Spread | Affects the cost of entering and exiting | Typical and event-time spread |
| Commission | May apply on selected account types | Per-side or round-turn charge |
| Funding | Accumulates when positions are held overnight | Daily time and current rate |
| Point value | Determines profit and loss per index point | Contract size and minimum trade |
| Currency conversion | Can alter the account-level result | Quotation currency and conversion fee |
The table is a checklist for comparison, not a promise that one index will always be cheaper. The right calculation uses the actual product terms and the trade’s expected duration.
Leverage, margin and position sizing
CFDs are leveraged derivatives, so a trader deposits margin rather than the full notional value of the position. This reduces the cash needed to open a trade, but it does not reduce the underlying market exposure. A small index movement can therefore create a relatively large change in account equity.
How CFD leverage works for index trading
If a position has a notional value greater than the margin deposited, the trader is using leverage. A rising market may benefit a long position and a falling market may benefit a short position, but both outcomes are magnified by the size of the exposure.
ASIC product intervention rules may limit leverage for retail clients, and a provider’s current terms should be checked. A general CFD margin and leverage guide offers useful background, but it cannot replace the specific disclosure for the account being used.
Comparing margin requirements across the two indices
Margin requirements can differ between the S&P 500 and ASX 200, and can also vary between cash and futures-style products. The quoted index level alone does not tell you the amount required to open a position. Contract value, point value and the broker’s margin percentage must all be considered.
A lower margin requirement is not automatically an advantage. It can simply make it easier to take a position that is too large for the account.
Calculating position size and potential losses
Start with the maximum dollar amount you are prepared to lose, then set the stop distance in index points. Divide the permitted loss by the stop distance and the value of each point to estimate the maximum position size. The calculation should allow for spread, slippage and the possibility of a gap.
For example, a trader risking $200 with a 40-point stop and a $1 point value would have a theoretical size of five units before transaction costs. The exact value and minimum size depend on the CFD specification.
Why leverage can magnify small index movements
An index may move only a fraction of a per cent, yet the cash result can be significant when the notional position is large. Losses can accumulate quickly during a volatile open or an unexpected announcement. Stops are useful controls, but they cannot guarantee the exact exit price in all conditions.
Risk should be set from the account backwards, rather than from the maximum margin available forwards. That distinction is central to safer index CFD trading.
Currency exposure and economic drivers
The ASX 200 and S&P 500 are linked to different economies, currencies and policy settings. Even when a CFD is displayed in an Australian trading account, the underlying index may still be influenced by exchange rates and overseas assets. Currency is therefore part of the context, not merely an administrative detail.
Trading the ASX 200 in Australian dollars
An ASX 200 CFD may feel more straightforward for an Australian trader because the index and account are commonly considered in Australian dollars. Local economic data, the Reserve Bank of Australia and domestic company news can be followed during familiar hours.
However, many Australian companies earn revenue overseas or sell commodities priced internationally. The Australian dollar can therefore affect sentiment and company valuations even when the trade is placed on a local index.
Managing US dollar exposure when trading the S&P 500
The S&P 500 is a US benchmark, and its movements are influenced by US dollar conditions, US rates and the value of global earnings translated into dollars. Depending on the CFD quotation and account currency, the trader may also face a conversion effect on profit, loss or funding.
Check whether the product is quoted in USD or converted by the provider, and understand the applicable conversion method. This is separate from deciding whether the S&P 500 itself is likely to rise or fall.
Interest rates, inflation and central bank decisions
Interest rates affect the discount applied to future corporate earnings and influence the appeal of shares relative to cash or bonds. Inflation data can move rate expectations before a central-bank meeting, producing sharp changes in both indices. The direction is not always immediate or simple because markets respond to the surprise against expectations.
A calendar-based approach is sensible: know which releases are due, when the relevant session opens and whether a position will be exposed when the announcement arrives.
Commodity prices, China and global risk sentiment
Commodity prices are a major consideration for the ASX 200 because resources companies are important index constituents. China’s growth outlook can matter through demand for Australian exports, while global risk sentiment can influence both Australian and US shares.
The S&P 500 is also sensitive to global conditions, especially through multinational companies and financial markets. Correlation can rise during a shock, but it should not be assumed to remain stable in ordinary sessions.
Choosing between the S&P 500 and ASX 200
The choice between these indices should follow the trader’s plan rather than a recent winner. Consider when you can monitor the position, which economic drivers you understand, and how much movement the account can withstand. A useful ASX 200 trading strategies guide can provide further ideas, but no strategy removes market risk.
When the S&P 500 may suit your trading approach
The S&P 500 may suit a trader who wants exposure to a large US benchmark, follows US economic releases or prefers the price activity around the American session. Its broad international visibility can also make it a natural instrument for a global risk-on or risk-off view.
That convenience comes with a timing cost for many Australians. Evening and overnight trading can affect concentration, sleep and the ability to respond to a fast market.
When the ASX 200 may be more practical
The ASX 200 may be more practical for someone who wants to trade during Australian hours and follows local banks, miners, employment data and monetary policy. The familiar session can make it easier to prepare for the open and review positions before the close.
Its concentrated composition still requires care. A resource-sector shock or a large move in financial shares can influence the index more than a trader expecting a perfectly diversified market may anticipate.
Matching the index to your preferred trading hours
A trading plan is easier to follow when its active hours fit normal life. Select the index whose main session you can monitor without rushing decisions or holding unwanted overnight exposure. If you cannot observe the US open, a strategy built around that moment may be unsuitable regardless of how attractive the chart looks.
Also check daylight saving changes, public holidays and the broker’s CFD hours. These details can affect the timing of orders and the information already reflected in the price.
Risk management practices for either CFD market
Risk controls should be consistent across both markets, while the settings are adjusted for each index’s volatility and point value. The following habits are practical starting points:
- define the maximum loss before placing the order;
- size the position from the stop distance, not available margin;
- check funding and dividend adjustments before holding overnight;
- avoid concentrating every trade around one economic release;
- review execution, spread and slippage after the position closes.
These practices do not predict the market. They simply make it less likely that one move will overwhelm the trading account.
Conclusion
The S&P 500 and ASX 200 offer broad but distinctly different CFD exposure: one is tied to a large US market and late Australian trading hours, while the other is closer to the local session and more concentrated in financial and resource companies. Compare the complete contract terms, understand the economic drivers, and keep position size small enough that an ordinary surprise remains manageable.
Frequently Asked Questions
Is the S&P 500 or ASX 200 better for CFD trading?
Neither is universally better. The suitable choice depends on your preferred trading hours, market knowledge, risk budget, contract terms and tolerance for overnight exposure.
What is the main difference between the S&P 500 and ASX 200?
The S&P 500 tracks 500 large US companies, while the ASX 200 tracks 200 major Australian companies. Their sector weightings and economic drivers are therefore different.
Can I trade the S&P 500 CFD during Australian hours?
Many providers quote an S&P 500 CFD outside the US cash session, but available hours, spreads and execution conditions vary. Check the product specification before placing an order.
Does the ASX 200 usually have lower volatility?
Not necessarily. Volatility changes with market conditions, commodities, company news and economic data. The ASX 200 can move sharply when local or global events affect its major sectors.
Do index CFDs involve currency risk?
They can. The index, CFD quotation and trading account may involve different currencies, and exchange-rate changes can affect the account-level result or trading costs.
What costs should I compare before trading?
Review the spread, commission, overnight funding, dividend adjustments, point value, minimum trade size and any currency conversion charge. Compare the full cost for your intended holding period.
How much should I risk on an index CFD trade?
Use an amount that remains affordable if the stop is triggered or execution is worse than expected. Position size should be calculated from the maximum acceptable loss and stop distance, not from the maximum margin available.