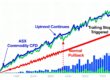
A polished backtest is not proof that your CFD strategy works. It is often proof that you found a set of rules capable of explaining one historical dataset.
That distinction matters. Traders treat five or ten years of data as a badge of seriousness, then mistake a smooth equity curve for evidence of a durable edge. I take the opposite view: the cleaner the backtest looks, the more aggressively you should interrogate how it was produced.
What everyone believes
The conventional wisdom is straightforward. Before risking real money, test the strategy on a large historical sample. Use enough data to cover different market conditions. If the results show acceptable returns, manageable drawdowns and a decent win rate across five or more years of ASX or forex data, you have completed the responsible part of the process.
Compared with jumping into a live account based on a tip, this sounds obviously sensible. Backtesting is treated as the scientific step separating disciplined traders from gamblers. The longer the sample and the smoother the curve, the stronger the supposed evidence.
That logic is appealing. It is also dangerously incomplete.
Why that’s wrong
A historical backtest does not merely test a strategy. It tests a strategy, a set of assumptions and a set of decisions made by the person running it. Most retail traders focus on the first item and underestimate the other two.
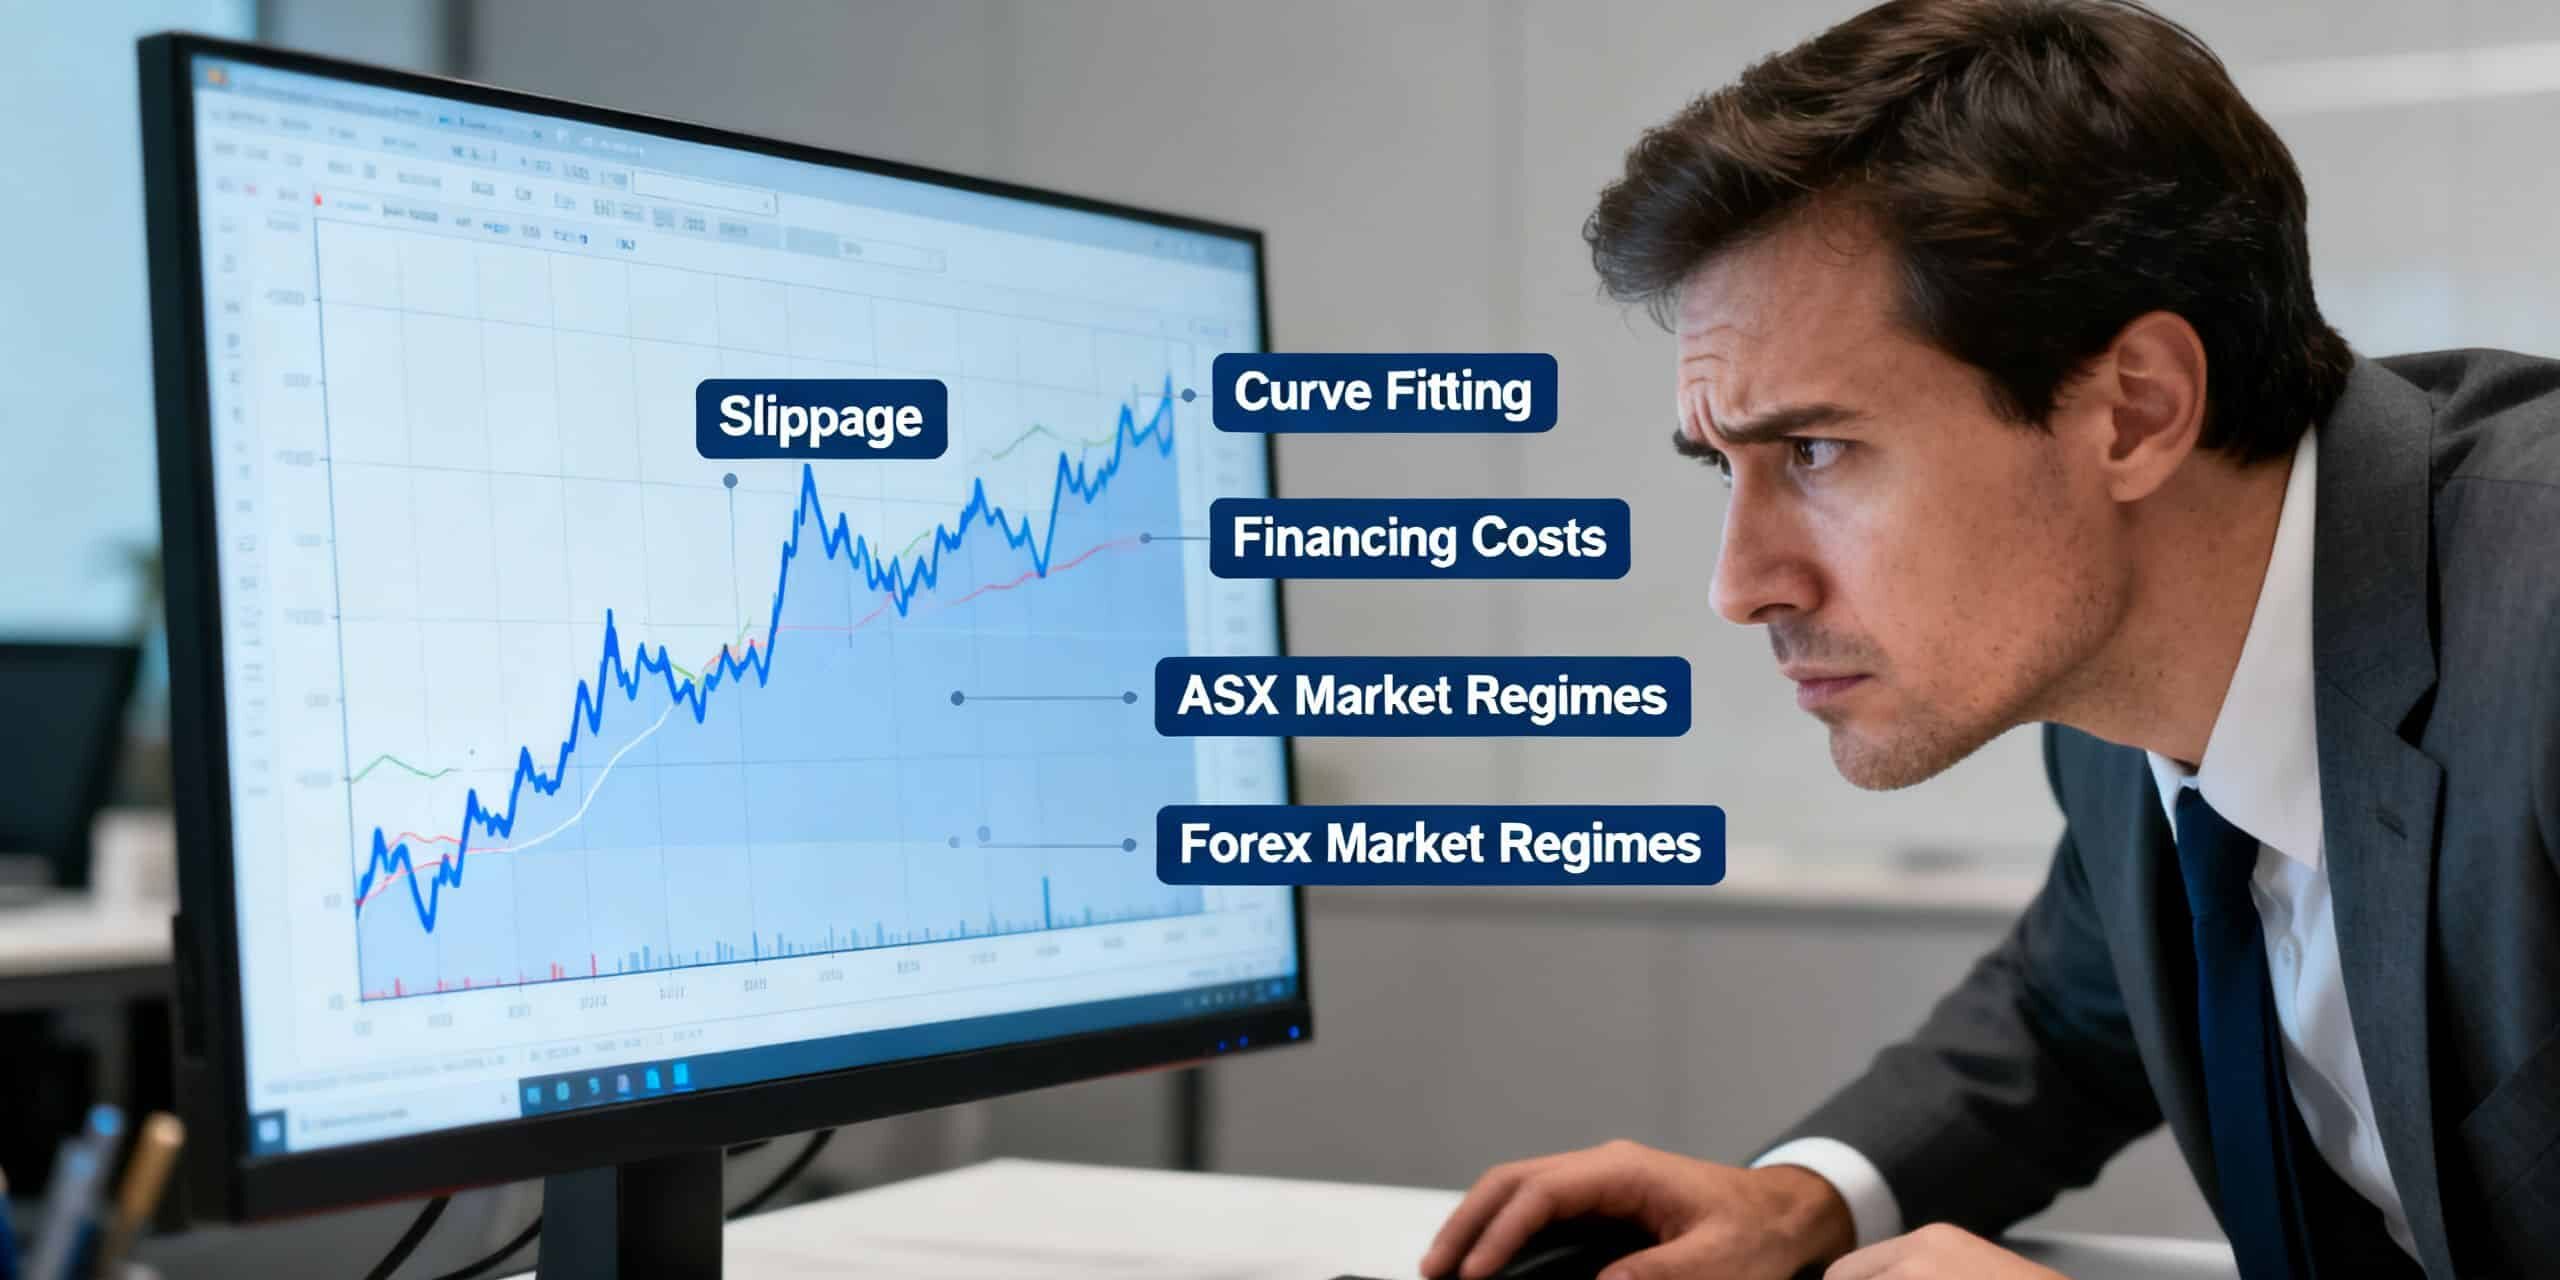
The biggest problem is curve fitting. You may not deliberately optimise a strategy until it breaks. You may simply adjust the moving-average lengths, stop distance, trading window, instrument, entry filter or position-sizing rule after seeing disappointing results. Each adjustment can look reasonable in isolation. Together, they can turn the historical sample into a target the strategy has been quietly trained to hit.
This is how a trader ends up with a backtest that has excellent entries, conveniently timed exits and a drawdown that looks tolerable on paper. The rules may be perfectly explicit. The spreadsheet may be accurate. The result can still be an overfitted explanation of the past rather than a useful forecast of the future.
Then there are the costs. Retail backtests often use a spread assumption that is too narrow, slippage that is too small or execution that is too precise. On a liquid major forex pair during calm conditions, the error may appear harmless. On an ASX index CFD around an opening gap, a volatile announcement or a thin trading period, it can materially change the trade outcome.
A strategy that makes a small average profit per trade is especially vulnerable. A few points of additional spread, occasional slippage and a realistic financing charge can turn a positive curve negative. The backtest did not discover an edge; it discovered that friction had been left out.
The third problem is regime change. Five years of data is not automatically five years of representative data. Markets do not repeat their conditions on request. The transition from ultra-low interest rates to higher rates changed currency relationships, volatility patterns, funding costs and the behaviour of many risk assets. A strategy that benefited from one liquidity environment can struggle when the incentives of large participants change.
A long sample can hide this rather than solve it. An attractive overall result may be carried by one unusually favourable period, while the current environment is behaving nothing like that period. Averaging incompatible regimes into one number creates false comfort.

The strongest objection is fair: abandoning backtesting would be reckless. Historical testing can expose obvious flaws, reveal how a strategy behaves in bad periods and prevent traders from relying entirely on intuition. That is true. But it does not make a clean backtest predictive. It makes backtesting a screening and stress-testing tool—not a certificate of future performance.
The mistake is not testing. The mistake is confusing a useful test with a verdict.
What I’ve seen instead
The most revealing backtests are rarely the ones with the highest returns. They are the ones that survive attempts to make them uncomfortable.
Consider what happens when a strategy is tested with less flattering assumptions. Widen the spread. Add random slippage. Charge overnight financing. Remove the best-performing trades. Shift the entry by one bar. Test the rule on a nearby instrument or a different market window. Split the historical data into development and validation periods instead of optimising across the whole sample.
A fragile strategy usually announces itself quickly. Its profitability depends on one exact parameter, one narrow session, one small group of trades or one unusually generous execution assumption. Change any of those and the equity curve collapses.
That collapse is not bad news. It is the most valuable result the backtest can produce. Finding out that a strategy cannot tolerate ordinary execution uncertainty before funding a live CFD account is a success, not a failure.
The opposite pattern is more credible: returns weaken under harsher assumptions but do not disappear; performance is distributed across multiple periods rather than concentrated in one lucky run; drawdowns remain survivable; and the strategy still behaves sensibly when parameters move within a reasonable range.
Notice what that evidence does not say. It does not say the strategy will make money. It says the result is less dependent on your historical choices. That is a much narrower claim—and a much more honest one.
It is also why a smooth curve should make you curious, not confident. Markets are noisy. Real strategies experience losing streaks, imperfect fills and periods when their logic stops fitting the environment. A near-perfect historical path may be a sign that the test has been cleaned up too aggressively.
What this means for you
Use your backtest to attack the strategy, not advertise it to yourself.
Start by writing the rules before looking for the best settings. If you optimise first and document later, you are likely to mistake discovery for validation. Keep a record of every parameter you change and why. A long list of small improvements is often evidence that you have been fitting noise.
Next, separate the data. Use one portion to develop the rules and a genuinely untouched portion to test them. Do not repeatedly inspect the validation period and then modify the strategy based on what you saw. Once you do that, it is no longer validation data.
Model the costs you will actually pay. Include realistic spreads for the instrument and time of day, slippage during volatile conditions, commissions where relevant, and CFD financing. If you cannot estimate those costs, assume your backtest is optimistic and treat the result accordingly.
Stress the strategy across regimes. Examine periods of high and low volatility, rising and falling markets, major news shocks and different interest-rate environments. A strategy does not need to work everywhere, but you need to know where it tends to fail. “Five years of data” is not a risk-management plan.
Then run sensitivity tests. Move parameters slightly. Randomise trade order. Remove the strongest winners. Compare nearby instruments without selecting only the one that performs best. The goal is not to create another impressive curve. The goal is to find out whether the underlying idea has room to be wrong without becoming worthless.
Finally, treat live trading as another test with real consequences. Start small enough that the first period of live execution is an information-gathering exercise, not a referendum on your identity as a trader. Compare actual fills, spreads, financing and slippage with the assumptions in your model. If reality is worse, update the model before increasing size.
Backtesting can help you decide whether a strategy deserves further investigation. It cannot tell you what the market owes you next.
The bottom line
A clean backtest over five or more years of ASX or forex data is not strong evidence that a CFD strategy will perform going forward. It is a hypothesis built from historical prices—and retail traders routinely make that hypothesis look better through curve fitting, optimistic execution assumptions and a failure to account for regime change.
Backtest to expose fragility, stress every assumption and validate cautiously in live conditions. The disciplined trader is not the one with the prettiest equity curve. It is the one most determined to find out why that curve might be wrong.