Most traders do not need more indicators on their charts. They need fewer excuses for taking trades they cannot explain.
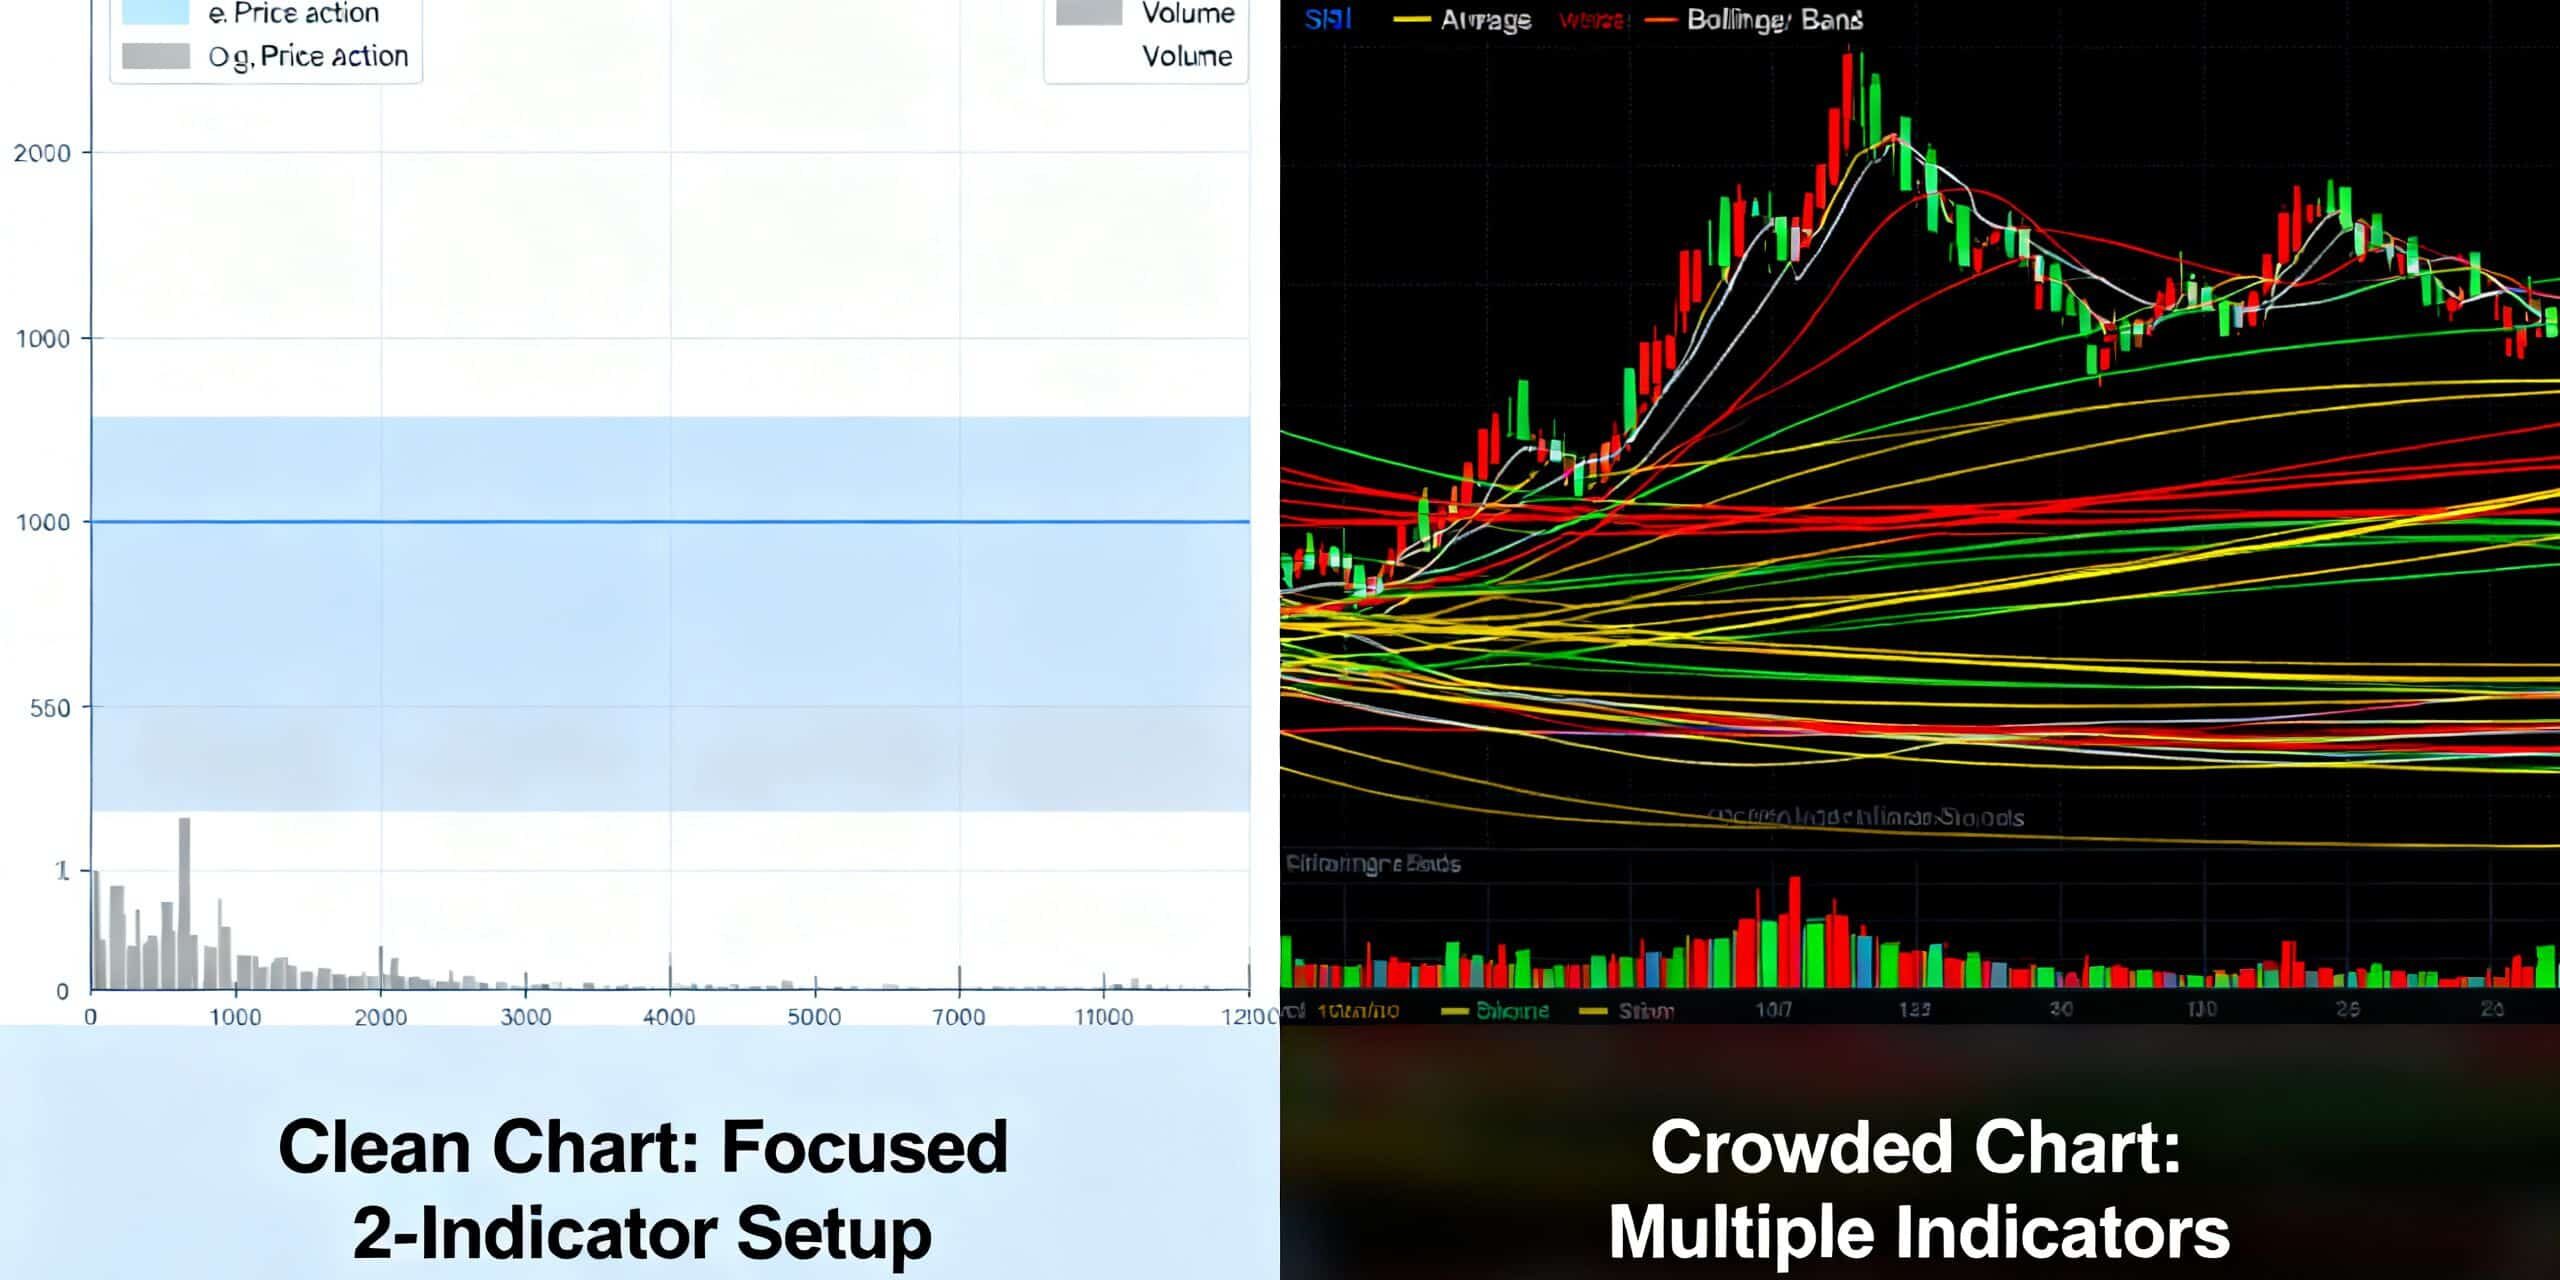
Stacking RSI, MACD, moving averages, Bollinger Bands, and whatever else is currently popular does not create better confluence. In most cases, it creates the appearance of independent confirmation from several tools that are all processing the same price data. The result is not greater rigor. It is false confidence.
What everyone believes
The conventional advice sounds sensible: never rely on a single signal.
If RSI says an asset is oversold, wait for MACD to turn bullish. Then check whether price is above the 50-period moving average. Perhaps Bollinger Bands show price reclaiming the lower band. If all four indicators agree, the trade supposedly has “confluence.” More agreement means more conviction. More conviction means a higher-quality setup.
There is a reasonable idea underneath this approach. A trader should avoid acting on one isolated observation. Markets are noisy, and a single indicator can be wrong. Cross-checking a trade against trend, momentum, and volatility can prevent impulsive decisions.
But the usual chart packed with indicators does not actually provide four independent checks. It often provides one piece of price information, repeated in four visual formats.
That distinction matters.
Why that’s wrong
Most popular indicators are derived from the same underlying inputs: price, time, and sometimes volume. They may use different formulas, but mathematical variety is not the same as informational independence.
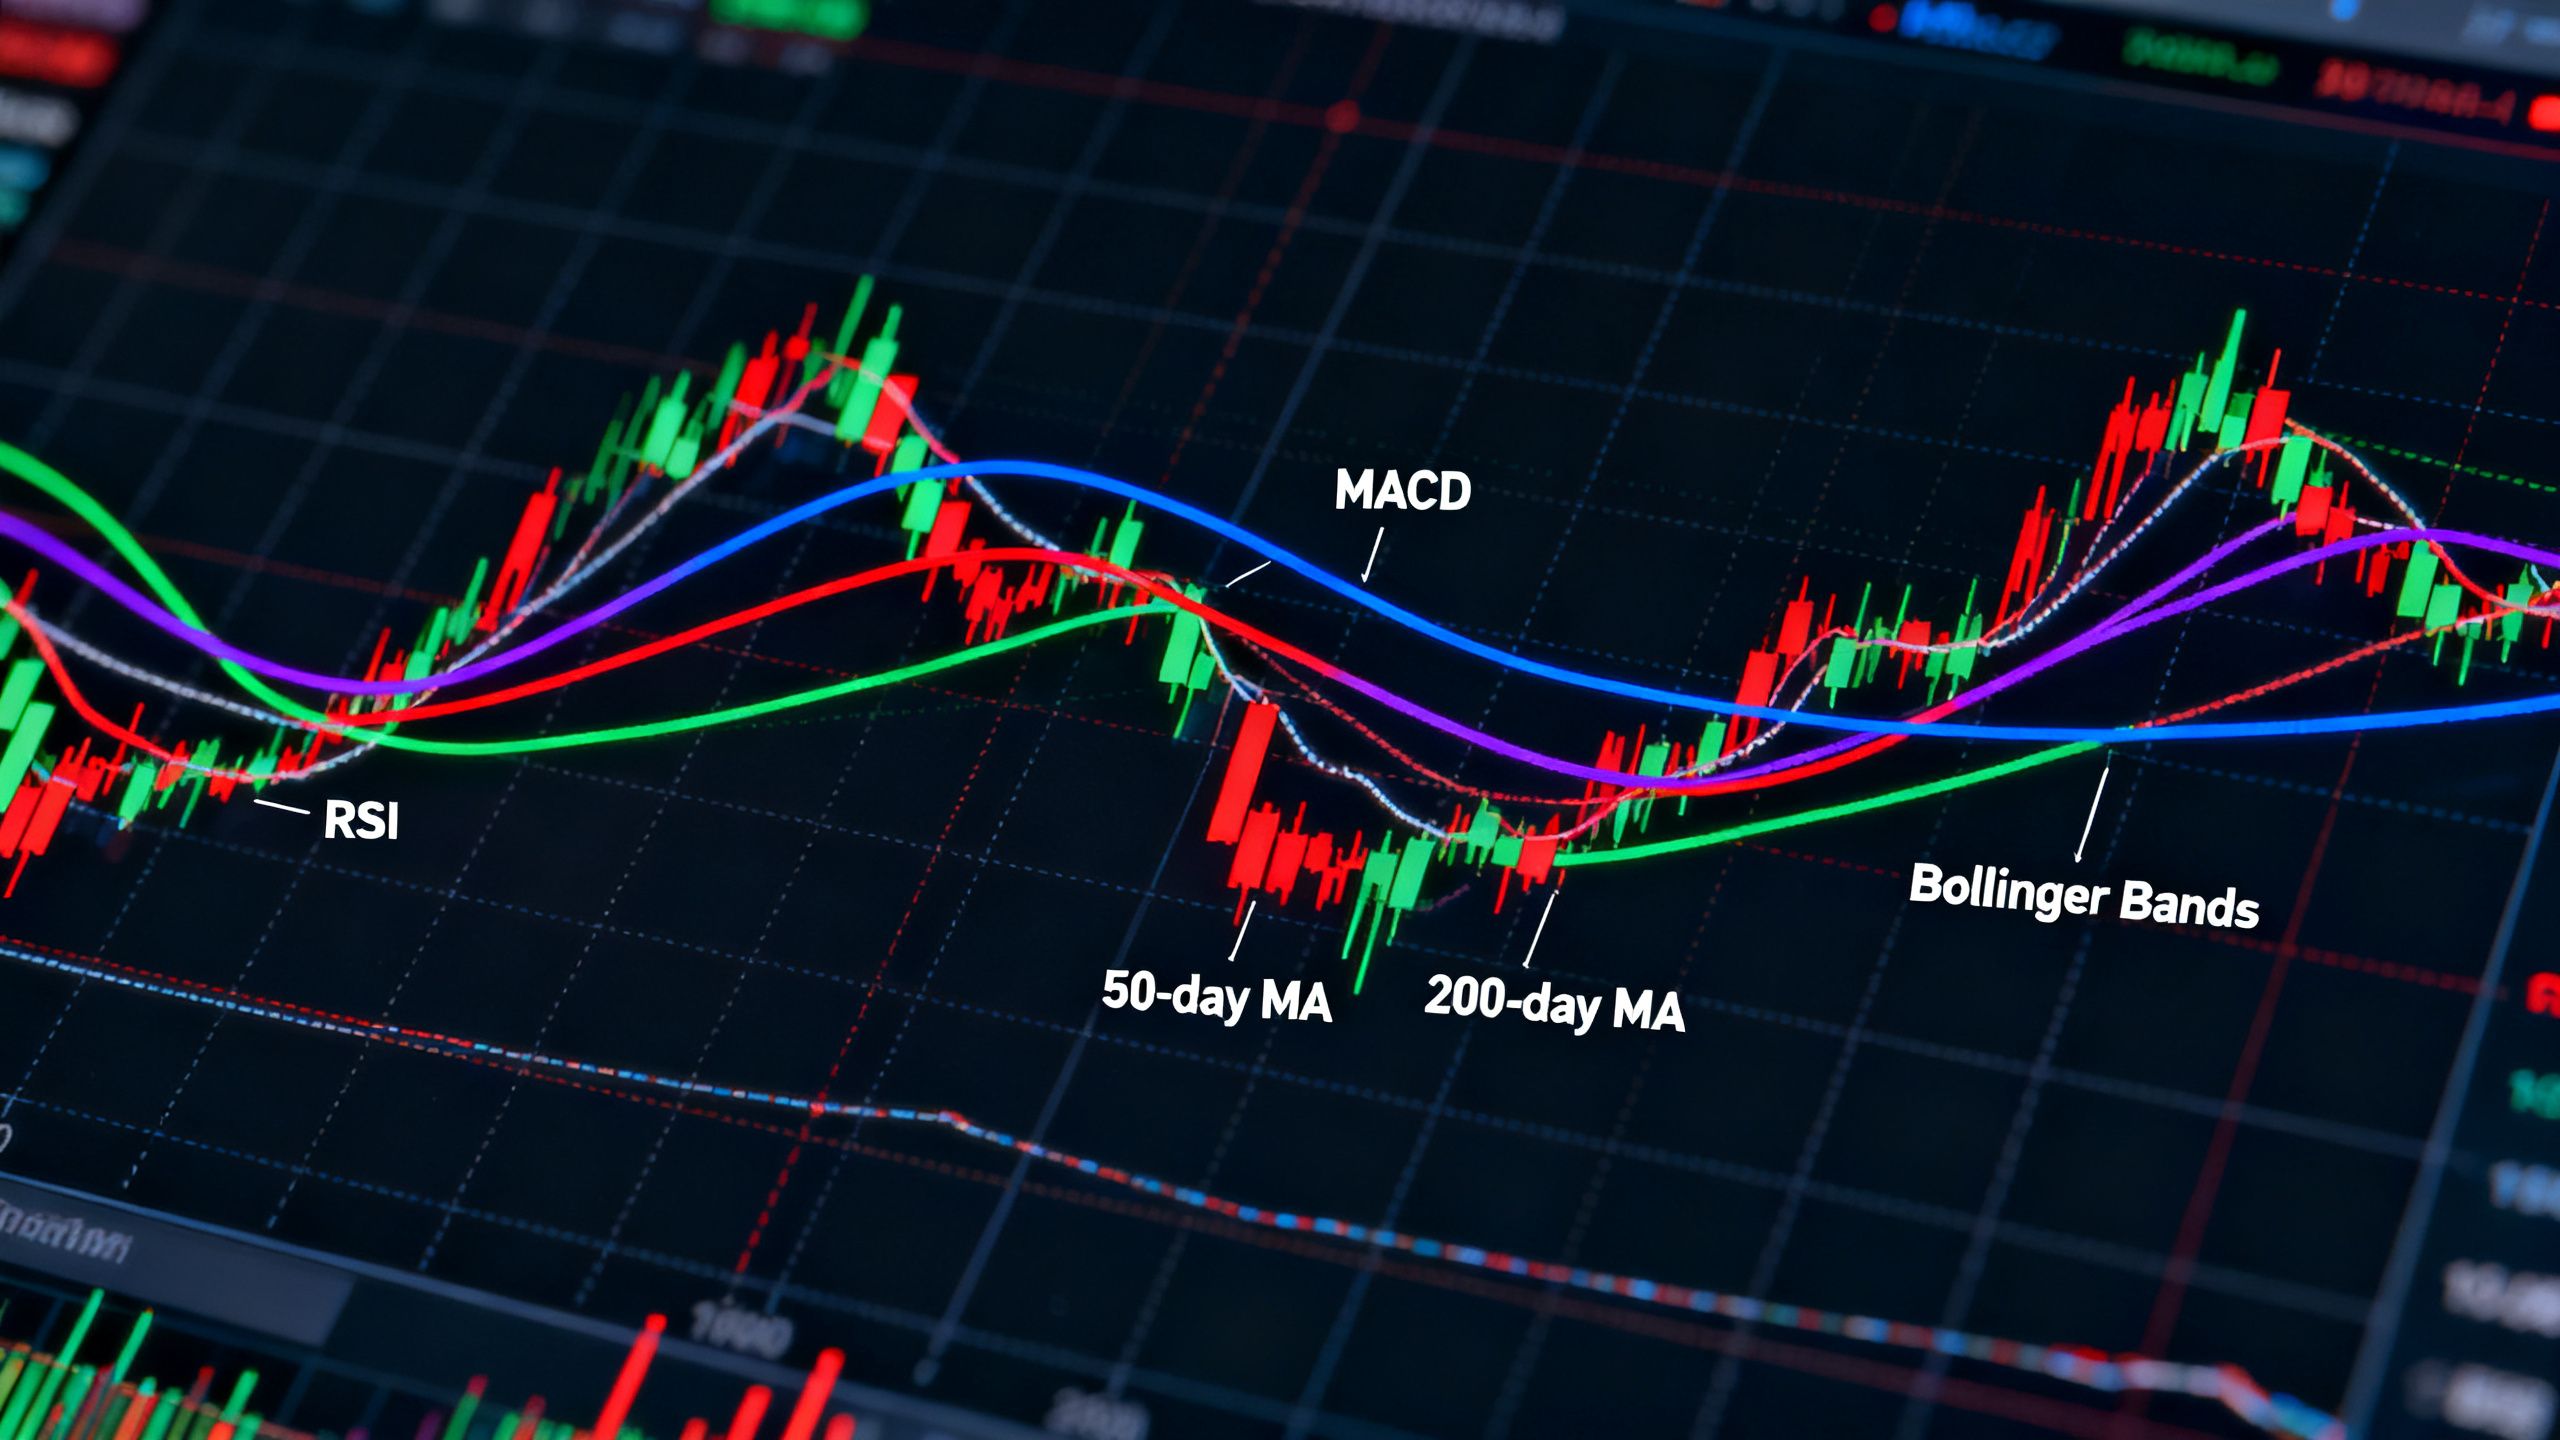
RSI measures the relative strength of recent gains and losses. MACD compares moving averages, which are themselves calculated from price. Bollinger Bands use a moving average plus standard deviation, also calculated from price. Moving averages directly smooth price. When these indicators “agree,” they are frequently responding to the same recent move.
Imagine a market that has fallen sharply over several sessions. RSI moves into oversold territory because losses have dominated gains. MACD remains below its signal line because short-term prices are weaker than longer-term prices. Price sits below a moving average. It also touches the lower Bollinger Band because the recent move is unusually weak relative to its recent range.
That looks like four bearish or potentially mean-reverting signals. It is usually one event: price has gone down.
The trader feels surrounded by evidence, but the evidence is correlated. Nothing in that collection independently confirms whether the decline will reverse, continue, or simply pause. The chart is not speaking with four voices. One voice is echoing.
This is where indicator stacking becomes actively dangerous. It does not merely add clutter. It changes the trader’s level of certainty without adding a proportional amount of information.
A trader who would pass on a weak setup may enter because three familiar indicators appear to agree. A trader who would normally cut a losing position may hold because one indicator has not yet “confirmed” the exit. The extra tools become a permission system for decisions the trader already wanted to make.
The strongest objection is easy to understand: even correlated indicators can help filter trades. That is true. A moving average can describe trend, RSI can describe momentum, and Bollinger Bands can frame volatility. Used deliberately, they may help organize a decision.
But that is different from claiming that their agreement creates independent confluence. The moment a trader treats correlated outputs as separate votes, the logic breaks. Four indicators cannot turn one underlying observation into four times the certainty.
What I’ve seen instead
The recurring failure pattern is not that traders know too little about indicators. It is that they know enough about each one to construct a persuasive story after the fact.
A chart shows a potential long trade. RSI is oversold, so the trader calls it a reversal opportunity. MACD is still negative, so the trader waits for a cross. Price is below the 200-period moving average, so the trader labels the setup countertrend. Bollinger Bands are expanding, so the trader decides volatility could produce a sharp bounce.
Every new indicator adds language. None necessarily adds clarity.
Then the market moves. If price rises, the trader credits confluence. If price falls, the trader says one indicator lagged or the setup needed another confirmation. The framework becomes impossible to falsify because there is always another condition that can be added later.
I have found a simpler test far more revealing: remove the indicators one at a time and ask what genuinely changes in the decision.
If removing MACD changes nothing because RSI and the moving averages tell the same story, MACD was not adding independent evidence. If removing Bollinger Bands only removes a visual boundary around a move already obvious from price, it was descriptive rather than predictive. If the entire trade thesis disappears when one familiar indicator is hidden, the thesis may have been an indicator relationship rather than a market-based idea.
The practical evidence is visible in how traders behave under pressure. Overloaded charts tend to produce later entries, delayed exits, and wider discretion. The trader waits for the full pattern of agreement, enters after much of the move has already happened, then refuses to exit because the indicators are temporarily mixed.
A smaller toolkit exposes the decision sooner. That can feel less sophisticated, but it is often more honest.
The goal is not to find a combination that makes uncertainty disappear. No indicator combination can do that. The goal is to define what each tool contributes, understand its limitations, and accept that a valid trade can still lose.
What this means for you
Start by assigning each tool one job.
Use a moving average, if you need one, to define a trend or market regime. Do not also count it as momentum confirmation. Use RSI to evaluate momentum or the conditions around a potential mean reversion. Do not treat an oversold reading as a guaranteed reversal. Use Bollinger Bands to understand relative volatility and location within a recent range. Do not mistake a touch of the band for a buy signal.
Then choose one or two tools that answer questions your price analysis cannot answer clearly. If both indicators are derived from price in nearly the same way, treat them as one family of evidence, not separate votes.
Write the trade thesis in plain language before looking for confirmation. For example: “Price is holding a prior support zone while the broader trend remains intact; I will enter if buyers reclaim the recent breakdown level, and I will exit if support fails.” That thesis can use an indicator as structure, but it does not depend on a magical alignment of colored lines.
You should also record what would invalidate the setup. This is more valuable than adding another confirmation tool. A trade plan with a clear invalidation level can survive uncertainty. A chart with ten indicators often cannot.
Finally, test the approach. Compare a simple framework using price plus one indicator against a crowded framework using four or five. Track entry timing, stop placement, missed trades, rule violations, and results across a meaningful sample. Do not judge the systems by one memorable winner. Judge whether the extra indicators improve decisions after costs, slippage, and execution errors.
If they do not, remove them.
The bottom line
More indicators do not automatically create more confluence. When several tools are derived from the same price data, their agreement is often repetition dressed up as confirmation—and repetition can make a bad decision feel unusually safe.
Use fewer tools, give each one a specific job, and build your trade around a falsifiable market thesis. The less your confidence depends on a crowded chart, the more likely your decisions are to survive contact with the market.