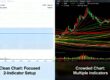
Most retail CFD traders do not need more timeframes before entering a trade. They need fewer opportunities to talk themselves into one.
The popular promise is that multi-timeframe analysis creates confirmation: identify the trend on a higher chart, refine the setup on a lower chart, and enter with greater confidence. I think that advice is backwards for most non-professional traders. More charts usually mean more opinions, more hesitation, and more ways to find a reason to click Buy or Sell.
What everyone believes
The conventional process sounds disciplined. Start with the daily or four-hour chart to understand the broader trend. Move to the hourly chart to locate structure. Drop to the fifteen-minute or five-minute chart to time the entry. If all three point in the same direction, the trade is supposedly confirmed.
There is a reasonable idea underneath this. A trader should not take a short-term long position directly into a powerful higher-timeframe downtrend without understanding the context. Looking at a broader chart can prevent tunnel vision. It can also help traders distinguish a meaningful level from random price movement.
That is the steelman. Context matters. Recklessly trading one tiny candle in isolation is not a serious process.
But “context matters” does not prove that checking four charts makes a decision better. At some point, analysis stops reducing uncertainty and starts manufacturing it.
Why that’s wrong
The problem is not that multiple timeframes contain useless information. The problem is that retail traders rarely use that information with the consistency required to make it useful.
Consider a simple sequence. The daily chart is bullish, so the trader wants a long. The four-hour chart is pulling back, which looks healthy. The one-hour chart shows support. The fifteen-minute chart breaks below that support, then recovers. Suddenly every chart supplies a different story:
- The daily chart says trend continuation.
- The four-hour chart says wait for the pullback to finish.
- The one-hour chart says price is near a buying area.
- The fifteen-minute chart says momentum has failed.
Which one is the confirmation? The answer often depends on what the trader already wants to do.
This is where multi-timeframe analysis quietly becomes confirmation bias with a professional-looking interface. A trader who wants to enter can call the higher timeframe “the trend,” the middle timeframe “the setup,” and the lower timeframe “the trigger.” A trader who is nervous can use the same charts to postpone the trade indefinitely. More timeframes do not remove discretion. They multiply it.
The standard advice also creates more places to enter. If the broad trend is up, every pullback can be framed as an opportunity. If the lower timeframe turns bullish, that becomes a trigger. If it turns bearish, the trader waits for a reversal. There is nearly always another reason available, especially in liquid CFD markets that move constantly during active sessions.
That is not the same as increased accuracy. It is increased narrative capacity.
And the time cost matters. Retail traders are not sitting at a proprietary desk with a tested playbook, clean execution data, and a risk team monitoring exposure. They are often checking charts between meetings, after work, or while emotionally attached to an open position. Asking them to reconcile several timeframes can make them slower at exactly the moment when their rules need to be simple.
A delayed decision is still a decision. Waiting for every timeframe to agree often means entering late, widening the stop, chasing the move, or skipping a valid setup because one chart refuses to cooperate.

The strongest objection is that a higher timeframe protects traders from bad lower-timeframe signals. Sometimes it does. A five-minute breakout against a clear daily downtrend deserves scrutiny. But “deserves scrutiny” is not the same as “must be filtered through an elaborate hierarchy of charts.” A single defined market condition can do that job. For example: only trade long when price is above a specified reference level, or only trade breakouts during a defined session.
The filter should be testable. If it cannot be written down before the trade, it is probably not a filter. It is a story assembled afterward.
What I’ve seen instead
The recurring pattern is simple: traders who add timeframes often feel more informed before the trade and less decisive during it.
They begin with a clear setup. Then they open another chart “just to confirm.” The higher timeframe looks extended. They open a third. The entry is now too close to resistance. They wait. Price moves. They chase. Or they take the original trade later, but with worse risk-to-reward and more emotional pressure.
The irony is that the extra analysis can make traders less accountable. With one chart and one rule, a losing trade is easy to classify: the setup failed. With five charts, the trader can blame the timeframe that “gave the wrong signal,” the one that was “not aligned,” or the sudden market noise. Complexity provides excuses along with information.
I have more confidence in a trader who can explain one repeatable setup than in one who can describe a sophisticated process involving monthly bias, weekly structure, daily trend, four-hour zones, hourly confirmation, and a five-minute trigger. The second process sounds more professional. The first is easier to execute, test, and improve.
That distinction matters because win rate is not created by the number of charts on screen. It comes from the relationship between a defined edge, risk, execution, and sample size. If adding a timeframe genuinely improves results, the improvement should appear in a trading journal or backtest—not merely in the trader’s feeling that the entry is better justified.
Most retail traders do not need a more persuasive reason to trade. They need a smaller decision surface.
What this means for you
Stop treating multi-timeframe alignment as a requirement. Treat it as an optional hypothesis that must earn its place in your process.
Start with one primary execution timeframe. Define the setup, entry condition, invalidation point, and risk before opening additional charts. If you use a higher timeframe, give it one job only—for example, identifying whether the market is in a broad range or directional move. Do not let it become a second source of entry signals.
Then test the difference. Record a meaningful sample of trades using your normal process. Record another sample with the extra timeframe filter. Compare more than win rate: measure expectancy, average loss, average win, time in trade, missed setups, late entries, and rule violations.
Pay particular attention to the costs that do not appear in a simple win-loss summary. Did the extra chart make you enter later? Did you skip trades that fit the original setup? Did you increase your size because the alignment looked unusually convincing? Did you move your stop when the charts disagreed?
If multi-timeframe analysis improves those numbers, keep the specific part that helps. If it only makes you feel safer, remove it.
A practical process might be deliberately boring: one market, one timeframe, one setup, one risk limit, and one reason not to trade. Boring is not a weakness in leveraged trading. It is a defense against impulse.
The bottom line
For most retail CFD traders, multi-timeframe analysis is not confirmation. It is extra room for bias, hesitation, and post-hoc storytelling. Use a higher timeframe only when you can define exactly what it changes and prove that the change improves your results.
Your edge will not come from looking at more charts. It will come from making fewer, clearer decisions—and executing them consistently.